Posts

Showing posts with the label EXCEL

Announcing the creation of connected tables in Excel Online

Image
We’ve also been working hard to ensure that all Microsoft 365 update channels are able to use this feature in the Excel desktop application. Insert a connected table in Excel online To connect directly to data in your semantic model: Select  Data from Power BI  on the  Data  tab of the ribbon Use the  search feature  in the Power BI Datasets pane to find the dataset/semantic model you’d like to connect to and select  Insert Table Use the  Create Table  dialog to: Select data to appear in your table in the  Data pane Apply any filters you’d like in the  Filters pane Rearrange the field order in the  Build pane Select  Insert Table . You now have a table connected directly to your Power BI semantic model. Just like with other Connected Table experiences, the workbook contains a connection that you can review and modify in the Queries and Connections properties. Updates to the Excel desktop application We have a quick update ...

Admin Monitoring of Power BI Usage in Excel

Image
We are excited to announce improvements to the Power BI activity logs that would help organizations gain insights on users connecting to Power BI datasets from Excel. With these improvements, admins can now track the usage of Power BI datasets in Excel, helping organizations improve data governance or fulfill regulatory compliance. Prerequisites To access the Power BI activity log, you must meet these requirements: Be a global admin or a Power BI administrator Install the Power BI Management cmdlets locally or use the Power BI management cmdlets in Azure Cloud Shell Monitoring usage of Power BI datasets in Excel with PowerShell In this example, a Power BI admin wants to identify users connecting to Power BI datasets from Excel Desktop and Excel for the web with the  Get-PowerBIActivityEvent  activity: Open PowerShell Run the  Get-PowerBIActivityEvent  cmdlet to download event data for the  AnalyzedByExternalApplication  activity. The  AnalyzedByExterna...

Advanced Analytics with Excel and Power BI

Join us for this webinar to learn how Microsoft Excel and Power BI bring advanced analytics to the daily business decision process, allowing users to extract useful knowledge from data to solve problems. You’ll also learn about capabilities such as: Data connection and mashup. Data modeling. R integration. Data Analysis Expressions (DAX).  Register and watch : Advanced Analytics with Excel and Power BI

Create Connected PivotTables in Excel for the web

Image
We are pleased to announce that connecting to Power BI datasets in Excel for the web is now available to all eligible Office users. This feature is another enhancement to working with Power BI data in the web following the general availability of connected PivotTables refresh in Excel for the web, announced in July 2021. With this new capability, you can now create PivotTables and charts in a web browser and take advantage of Excel features such as co-authoring, enabling you to collaborate with others on data projects while ensuring your reports stays connected to Power BI with up-to-date data. Also, your Excel reports inherit Microsoft Information Protection (MIP) labels in Power BI so that your data remains secure. How to connect to Power BI datasets in Excel for the web 1. Navigate to https://www.office.com and open a new blank Excel workbook 2.  Select Insert in the Excel ribbon and under PivotTable, select the new From Power BI option that allows you connect t...

Create Power BI report from excel data source

Image
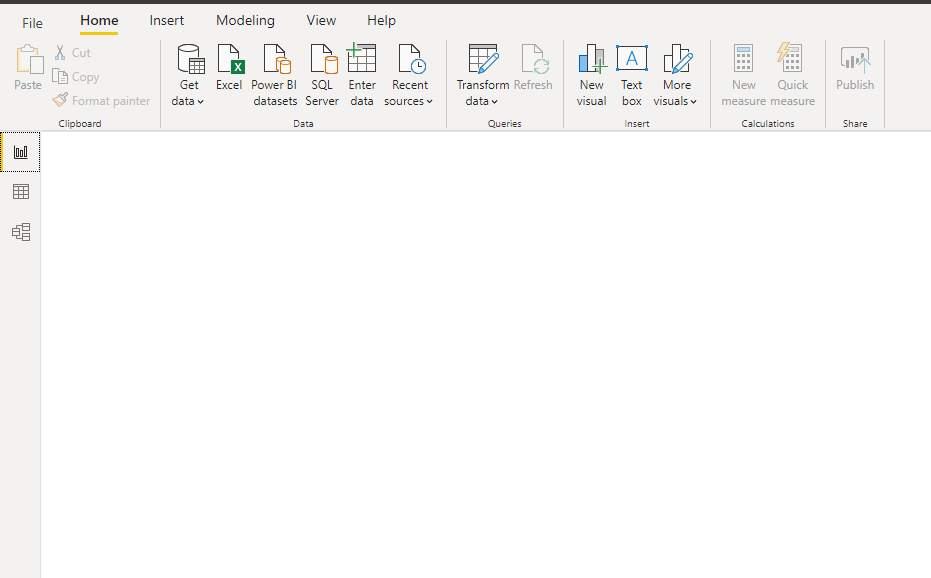
Step 1: Open Power BI desktop application Step 2: Click on Get data under home tab and select excel data source as shown in bellow Step 3: Select excel file from local system Click on check box as shown in bellow Step 4: Click on Load icon Step 5: All fields are appearing in fields section as shown in bellow Step 6: Click on three dots (...) and rename the sheet name Step 7: Drag and drop table from visualization tab to design panel Step 8: Select required fields from data set as shown in bellow

Create SSRS report from EXCEL DataSource

Image
Step 1: Go to Report Data and create data source Step 2: Provide data source name Click on edit button and provide data source type as shown in bellow   Step 3: Click on advanced tab Click on new button Step 4: Click on next Step 5: Select proper drivers for data source and click on next Click on finish button Step 6: Click on excel source section and select data source file Step 7: Go to data set tab, create new data set Step 8 : Select data source and provide SQL query as shown in bellow. select * from [SalesOrder$] Here [SalesOrder$] is excel sheet name Click on fields tab and check list of fields Step 9: Go to design pane and add table as shown in bellow Step 10: Drag and drop required fields Click on preview