Posts

Showing posts from January, 2024

IPL Dashboard in Power BI

Image
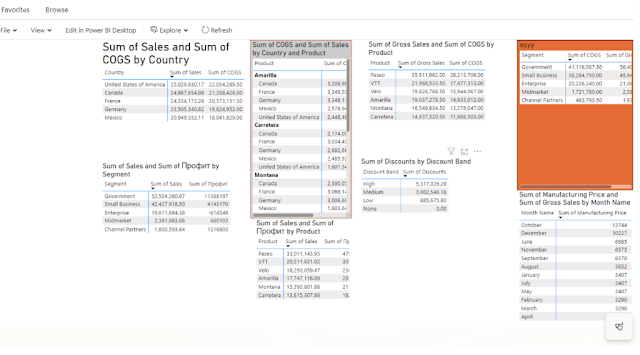
Have prepared IPL dashboard in Power BI and have published in public portal to view everyone. Please refer bellow screen shots for dashboard.  IPL Dashboard:  IPL Dashboard

Power BI Report Server January 2024 Feature Summary

Image
We have made it easier for report consumers with visual impairments to get tabular data for all visuals on a page with one selection, displaying the data in the way that best meets their particular needs with  show visuals as tables , an added menu item. We promised you better looking reports, we are now delivering  extended data labels,  and more  styling options , which improves aesthetics  for column and bar charts,  an added benefit for neurodivergent individuals with cognitive disabilities. Contents Reporting Show visuals as tables More styling options for column and bar charts Extended customization for data labels Reporting Show visuals as tables Leveraging our  previous accessibility improvements  to table and matrix, we are now introducing a new view mode called  Show visuals as tables  which displays report visuals in a tabular format with a single action. Some users may prefer to consume data in a text-based or tabular fo...

Dynamic subscriptions for Power BI reports (Preview)

Image
We’re excited to announce that dynamic per recipient subscriptions are now available in Preview for Power BI reports! Similar to  dynamic subscriptions for paginated reports , you can now distribute a personalized copy of a Power BI report to each recipient of an email subscription. How it works What you’ll need to get started Setting up a dynamic per recipient subscription Things to keep in mind We want to hear your feedback How it works Imagine you have a report that includes sales data for your entire team. You want to schedule an email subscription that sends out a PDF copy of this report to each salesperson on a weekly basis, with the report filtered to only show their sales results. This can now be done by connecting to a semantic model (previously  Power BI dataset ) that defines the mapping between recipients and respective filter values. When it’s time to send out the report, the latest data available in your semantic model will determine which employees should receiv...

Ultimate Fabric learning event!

Image
Save your seat at the ultimate Fabric learning event! Join us for the  inaugural Microsoft Fabric Community Conference  on March 26-28, 2024, at the MGM Grand, Las Vegas. With 150+ sessions and workshops on March 24, 25, and 29, it’s the ultimate learning event for Microsoft Fabric! Save your seat now  and use  code  MSCUST  for a  $100 discount ! The Fabric Conference covers the latest in analytics, AI, databases, and governance with workshops and sessions led by Microsoft MVPs, the Product Team, partners, and the community. Connect with Fabric community members and Microsoft data users globally, building relationships while learning from success stories. Discover Microsoft Fabric’s  latest features  and its role in unifying your data estate. Upskill your data teams with  hands-on training  on Power BI, Synapse, Data Factory, and Azure databases. Learn how  Microsoft Purview  can govern and secure your entire data estate....

Copilot in Power BI (preview) is available worldwide

Image
This preview includes Copilot for Power BI, Data Factory and Data Science & Data Engineering. Since then, we have been gradually rolling this feature out and today,  we are excited to announce that our Copilot preview is now available  to all customers with Premium/Fabric capacity Getting started with copilot With our current preview, users can create reports faster and easier in the Power BI web experience. Based on a high-level prompt, Copilot for Power BI in Fabric creates an entire report page for you by identifying the tables, fields, measures, and charts that would help you get started. You can then customize the page using our existing editing experiences. Copilot can also help you understand your semantic model and even suggest topics for your report pages. It’s a fast and easy way to get started with a report, especially if you’re less familiar with report creation in Power BI. In addition to report creation, we’re excited to bring the Copilot’s unique abilit...