Posts

Now it’s easier to find Power BI reports in Microsoft Teams tabs

Image
Modern work requires keeping everyone up to date and using data to make decisions. That’s why so many organizations use Power BI in Microsoft Teams to keep data top of mind and one click away where people work. When working in channels, chats, and even in meetings, adding a Power BI report as a tab is a quick and easy way to nurture a data culture within your teams during collaboration. Now, we’re making it easier to find Power BI tabs you’ve used in Team channels. We’ve started to roll-out an update to the home experience in the   Power BI app for Microsoft Teams. Users in Teams will see a new “In Teams” pivot on Power BI home. This new capability makes it easy to find Power BI tabs you’ve visited previously in Teams channels. New In Teams pivot on Power BI home in Teams In September 2020, we released the Power BI app for Microsoft Teams, which is a data hub available right where people work. Users can access all their reports, dashboards, and Power BI organizational apps in one p...
Create Power BI report from ODATA source

Image
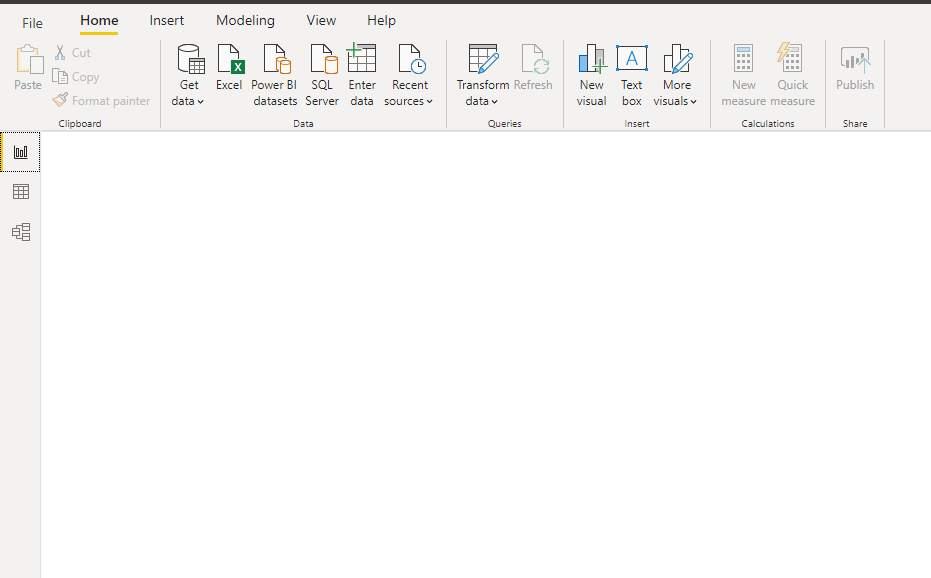
Step 1: Open Power BI desktop application Step 2: Click on Get data under home tab and select OData feed data source as shown in bellow Step 3:  Provide OData feed URL as shown in bellow Step 4: Bellow screen shot showing list of the tables associate with URL Step 5:  Select required tables in list Step 6: Click on load button Step 7: All fields are appearing in fields section as shown in bellow Step 8: Drag and drop table from visualization tab to design panel Step 9: Select required fields from data set as shown in bellow  

Create Report from XML source in Power BI

Image
Step 1: Open Power BI desktop application Step 2: Click on Get data under home tab and select more source as shown in bellow Step 3: Select XML source as shown in bellow Step 4: Select XML file from local system Click on check box Click on Load to load data to Power BI desktop Step 5: All fields are appearing in fields section as shown in bellow Step 6: Drag and drop table from visualization tab to design panel Step 7: Select required fields from data set as shown in bellow  

Power BI report from JSON data source

Image
Step 1: Open Power BI desktop application   Step 2: Click on Get data under home tab and select more as shown in bellow Select data source type as JSON Step 3: Select .json file from local system Click on close & apply button as shown in bellow Step 4: JOSN file fields as showing in fields section Step 5: Drag and drop required fields into table  

SQL Saturday Los Angeles June 2021

Data.SQL.Saturday.LA is a FREE one-day training event for Microsoft Data Platform platform professionals. The event offers high quality technical training on a variety of Data related subjects, such as: Data Analysis, SQL and No-SQL, Database Administration, DevOps, Development, Microsoft Azure, Amazon Web Services, Google Cloud Platform, Data Science and Machine Learning, Business Intelligence and Analytics, Women In Technology, Personal Branding. This is a great opportunity for all the Data professionals to network with peers and learn from Microsoft/AWS MVPs and other local and international speakers. Please register soon, and let friends and colleagues know about the event.  Register :  SQL Saturday Los Angeles June 2021

SQL Server High Availability in Google Cloud Platform

Are you taking full advantage of your cloud service provider? Google Cloud Platform (GCP) offers on-demand compute, networking and storage for your business-critical applications and now with the latest innovations in GCP, smart analytics solutions. In this webinar, Dave Bermingham, Microsoft Cloud and Datacenter Management MVP, is joined by Google's Anibal Santiago, to discuss what's new with GCP, how to deploy SQL Server in the GCP with an eye towards high availability and disaster recovery. Learn how to leverage GCP and SIOS to increase operational efficiency and optimize IT spend without having to worry about capacity, reliability, or performance. Webcast Date Thursday, May 20, 2021 1:00:00 PM EDT (New York) | 5:00:00 PM UTC   Register :  sql-server-webcast

Microsoft SQL Server SSRS Course, 2-Day, Webinar Virtual Classroom

About this event Visual data with Microsoft SQL Server SSRS Course This SQL SSRS course focus on producing reports using MS SQL SSRS: how to use the product features and tools related to data retrieval, visualisations and deployment. The Target Audience: end-users who will produce reports for their department or group without in-depth SQL knowledge. Virtual Classroom:  Attend online, Instructor-led, Interactive, Practical, Online. Duration: 2 consecutive days, the first of which is displayed in the booking options. SQL SSRS Course Outline Report Models Data source views Creating a model Entities, attributes and roles Tables Creating tables Interactive sorting Floating headers Grouping Inserting groups Group headers/footers Displaying group totals Expanding and collapsing Expressions The expression builder The Report Items collection Built-in fields Conditional formatting expressions SQL SSRS Page set-up Page headers and footers Page names and n...