When you want to summarize data in a visual format, use the chart data region. Charts enable you to present large volumes of aggregated information at a glance. It is important to carefully prepare and understand your data before you create a chart, as this will help you design your charts quickly and efficiently.
Step 1:
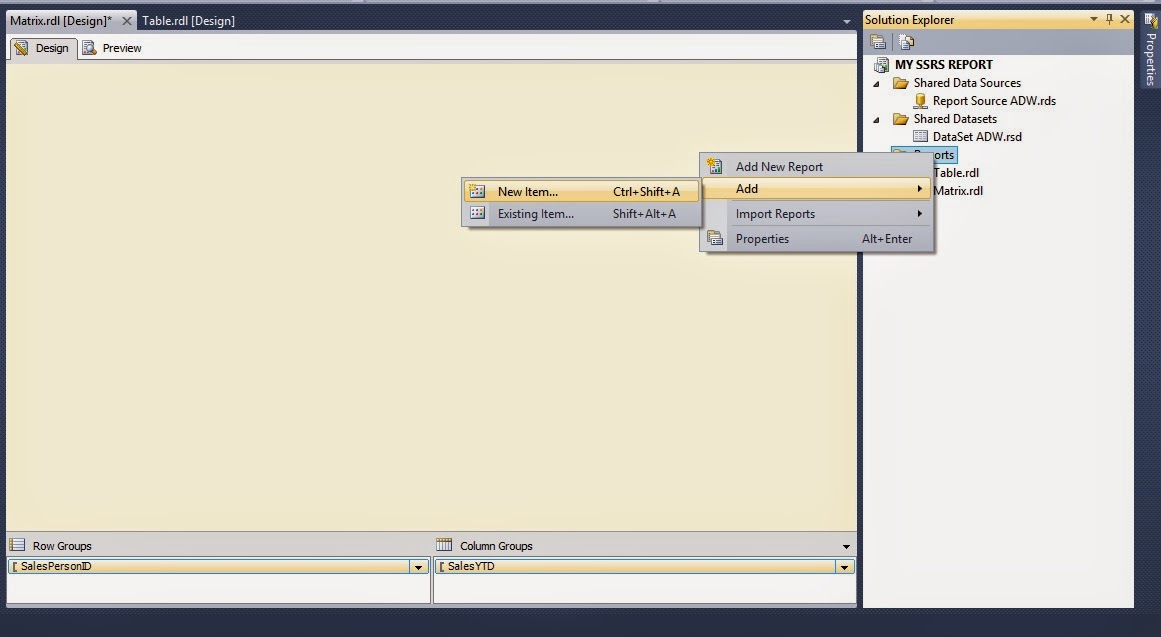
In the Solution Explorer, right click on the "Reports" folder and click on Add -> New Item as shown below:
Step 2:
In the Add New Item dialog box, select the "Report" template and specify the name of the report that you are creating, as shown below:

Step 3:
Then click on Add button. So your blank report is added

Step 4:

Step 5:

Step 6:

Step 7:
It will take you to the screen of Dataset Properties, where you can use either shared dataset or embedded dataset in report. Here we use embedded dataset.

Step 8:
Now as we are done creating the SSRS project, the Report, the Data Source and the Dataset, the next step is to create the Chart in the report. To add a Chart to your report, go to Toolbox and under Report Items you will see the Chart icon as shown below; drag it to the report designer area.

Step 9:
Now your report design looks like below

Step 10:

Step 11:
Click on chart properties and select Show Data Labels

Step 12:
Now to see how your report will looks like click on Preview Tab.So your result looks like below

Step 1:
In the Solution Explorer, right click on the "Reports" folder and click on Add -> New Item as shown below:
Step 2:
In the Add New Item dialog box, select the "Report" template and specify the name of the report that you are creating, as shown below:
Step 3:
Then click on Add button. So your blank report is added
Step 4:
To create a data source, right click
on Data Sources in Report Data Pane and click on Add Data Source as
shown in below screen shot:
Step 5:
It will take you to the screen of Data
Source Properties, where you can use either shared data source or embedded
data source in report. Here we used a shared data source.
Step 6:
Now you need to create a data set.
To create a Dataset, right click on Datasets
in Report Data Pane and click on Add Dataset as shown in below screen shotStep 7:
It will take you to the screen of Dataset Properties, where you can use either shared dataset or embedded dataset in report. Here we use embedded dataset.
Step 8:
Now as we are done creating the SSRS project, the Report, the Data Source and the Dataset, the next step is to create the Chart in the report. To add a Chart to your report, go to Toolbox and under Report Items you will see the Chart icon as shown below; drag it to the report designer area.
Step 9:
Now your report design looks like below
Step 10:
Now click on Chart Area. It will
open Chart Data Pane.
Click on + sign in right side of
Category Groups and select Sum(SalesPersonID) from available fields.
Similarly click on + sign in
right side of Series Groups and select Bonus.
Similarly click on + sign in
right side of Values and select Sales Last Year.
So now your chart data window looks
like below:
Step 11:
Click on chart properties and select Show Data Labels
Step 12:
Now to see how your report will looks like click on Preview Tab.So your result looks like below
Great article,Thank you for sharing this valuable info with us.
ReplyDeleteKeep updating...
MSBI Online Training
Thank you for your valuable feedback
Deleteyour valuable information and time. Please keep updating
ReplyDeleteMsbi Online Training in Hyderabad
Msbi Online Training in India
Thanks for your feedback
DeleteI really liked your blog post.Much thanks again. Awesome.
ReplyDeleteMsbi Online Training in India
Msbi Training