Create Power BI report from excel data source

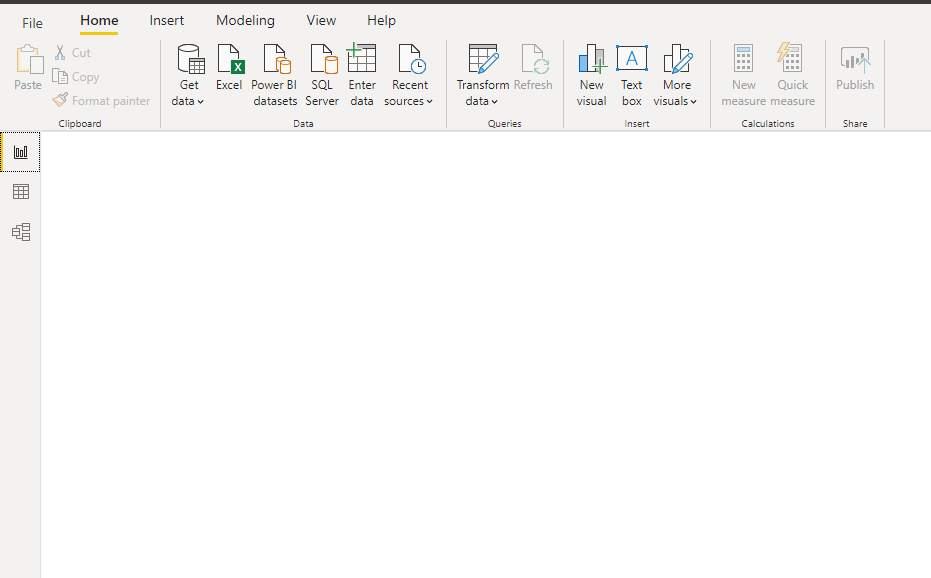
Step 1: Open Power BI desktop application Step 2: Click on Get data under home tab and select excel data source as shown in bellow Step 3: Select excel file from local system Click on check box as shown in bellow Step 4: Click on Load icon Step 5: All fields are appearing in fields section as shown in bellow Step 6: Click on three dots (...) and rename the sheet name Step 7: Drag and drop table from visualization tab to design panel Step 8: Select required fields from data set as shown in bellow


